FWD Resources
The Data Analytics Toolbox
Welcome to the Data Analytics Toolbox. Here you will find overviews and how-to articles on topics geared towards helping you become a better data analyst. This includes reviews of tools, guides, and more.
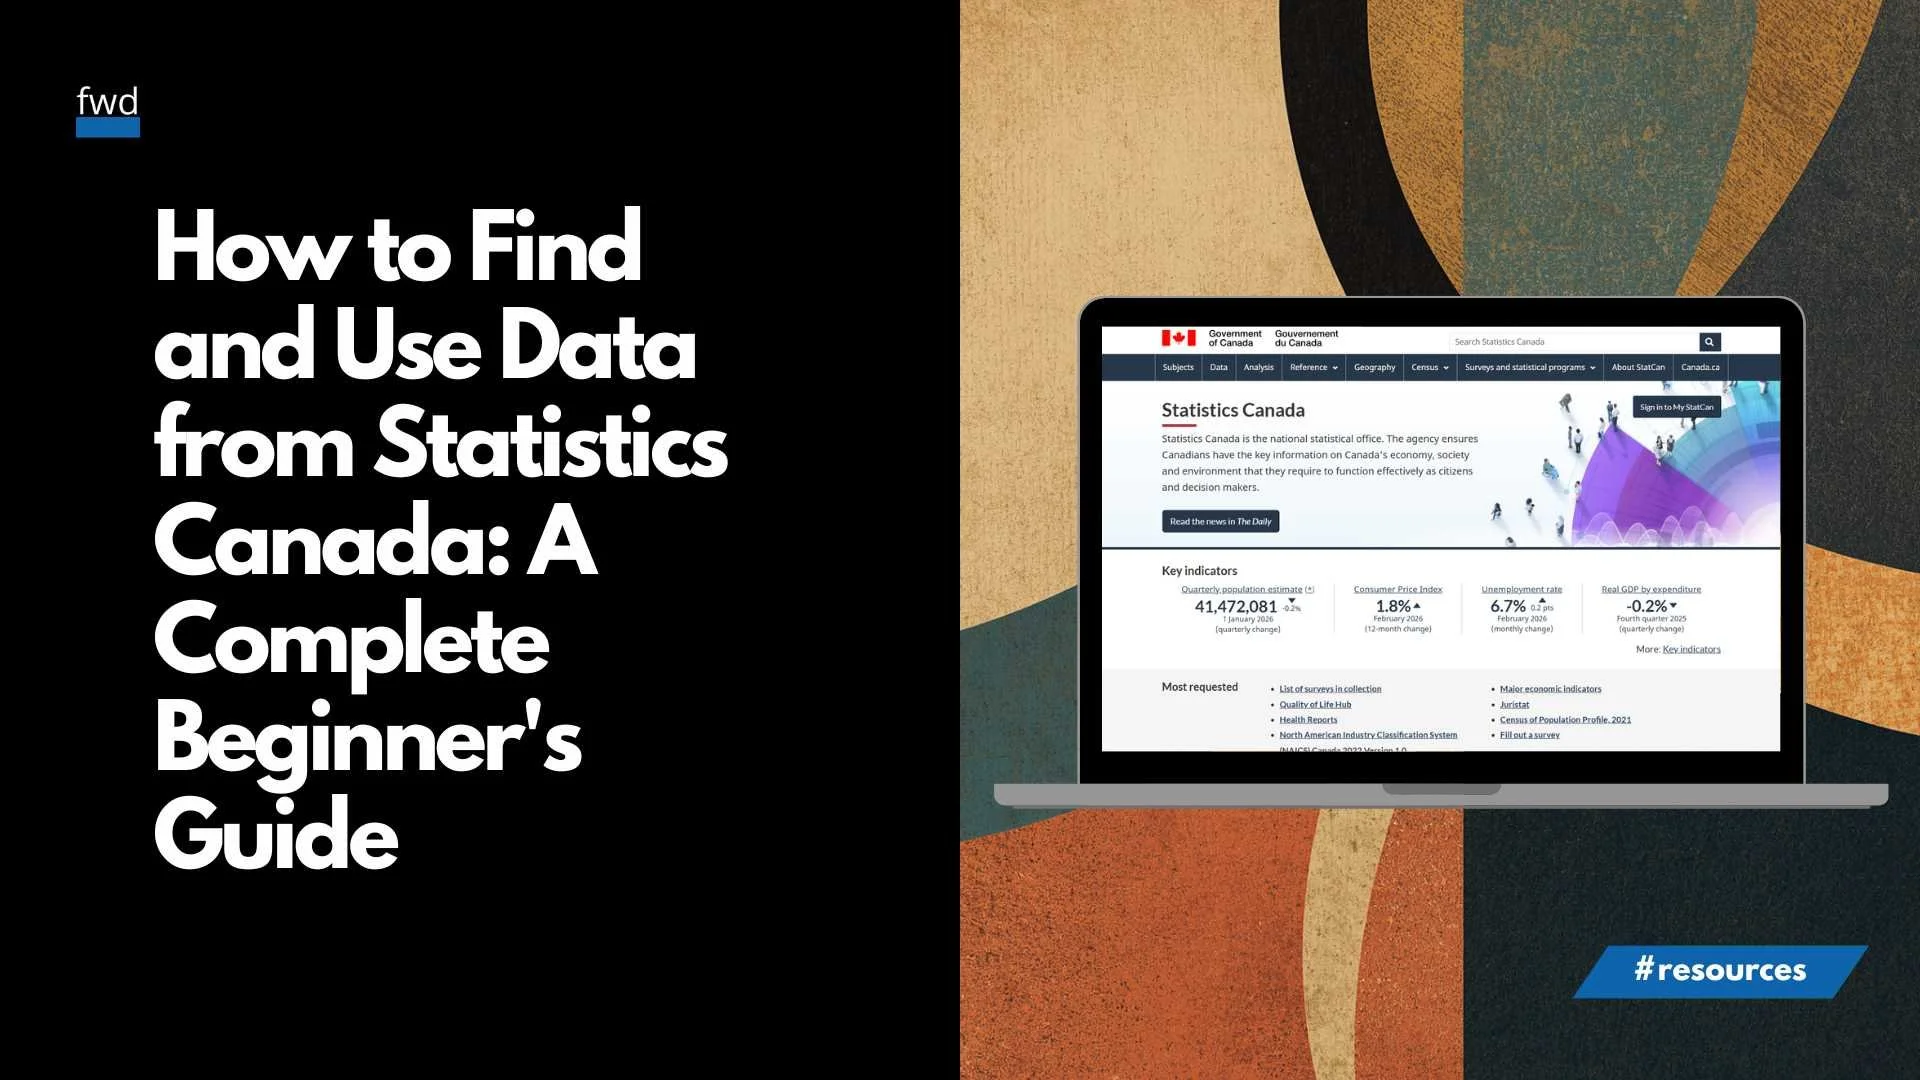
How to Find and Use Data from Statistics Canada: A Complete Beginner's Guide
Statistics Canada is Canada’s official source for economic, social, and census data—but if you've never used it before, the sheer volume of information can feel overwhelming. This guide will walk you through everything you need to know to find, understand, and download Canadian statistics with confidence.
Where to find free Canadian government datasets
Federal, provincial, and municipal governments, and government agencies publish an enormous amount of publicly available data. The challenge is knowing where to look. Learn about the the most important open data portals in Canada.

Understanding World Bank Data: A Beginner’s Guide to Preparing It for Analysis
Learn how to download, clean, and transform World Bank data for analysis. This step-by-step guide explains dataset structure, wide vs. long formats, and how to prepare World Bank indicators for use in Excel, Google Sheets, or data visualization tools.

How to Find Key Financial Metrics for Canadian-Listed Companies
Learn how to find key financial metrics for Canadian-listed companies using SEDAR+ filings and IFRS reports. This guide covers where to locate revenue, expenses, EPS, cash flow, and executive compensation in Canadian disclosure documents like annual reports, MD&A, and AIFs.

How to Find Key Financial Metrics in US Corporate Disclosure Documents
Learn where to find revenue, expenses, net income, EPS, executive pay, EBITDA, cash flow, and other key financial metrics in corporate filings like SEC 10-Ks and DEF 14A.

Chart Design Tips Every Data Analyst Should Know
Learn how to make better data visualizations inspired by Storytelling with Data. Discover 10 chart design tips that help you simplify visuals, use color effectively, and communicate insights clearly.

7 Common Data File Types Every Data Analyst Should Know (and How to Open Them)
Learn the seven most common data file types every new data analyst should know — including CSV, Excel, JSON, Parquet, SQL, XML, and Feather — and how to open and work with each format.

Exploratory vs. Explanatory Charts: What’s the Difference?
Master the art of data visuals—learn when to explore insights and when to present them plainly with polished, audience-ready charts.

How to tell engaging stories with data
Transform numbers into compelling narratives. Learn to communicate with clarity, purpose, and impact—even if you're not a data expert.
10 Common Chart Mistakes and How to Avoid Them
Avoid misleading visuals. Discover the top charting errors—from chart type choices to misleading scales—and how to fix them fast.
A data analyst’s guide to making informative charts
Design visuals that clarify, not clutter. Follow practical steps—from choosing the right chart to simplifying design—for clearer insights.

Dimension Tables vs. Fact Tables: A Practical Guide for Aspiring Data Analysts
Build better spreadsheets and dashboards. Learn how dimension and fact tables structure your data clearly—even in Google Sheets or Excel.

10 steps to analyze any dataset with confidence
We sift through tons of data from different sources to uncover the insights we share in our articles. These 10 steps will help you analyze any dataset with confidence

How to Use GeoJSON Files: A Beginner’s Guide
If you're working with maps, spatial analysis, or location-based data, you'll likely encounter GeoJSON files. In this article, we’ll break down what you need to know about GeoJSON, how to create one, and the tools you can use to open and work with it.

Common geospatial data types and file formats explained
In this guide, we’ll explain the most popular geospatial datatypes and file formats, what they’re used for, what software can open them, and how to choose the right one for your project.

A step-by-step guide to converting maps into shapefiles
In this guide, we’ll explain what shapefiles are, why they matter, and how to convert a map into a shapefile using simple steps.

Essential Data File Formats and How to Use Them
Data is stored and exchanged in various file formats. Each format serves a specific purpose, ranging from text storage to complex databases. Understanding these file types, their uses, and the tools required to access them is essential for efficient data handling.

Scraping data to create a custom dataset
What do you do when you can’t find a dataset for your project? Well, one option is to scrape websites for the data you need. Here’s an example of how it’s done.

What is open data and why should you use it?
Learn what Open Data is, why governments publish it, and how analysts, developers, journalists, businesses, students, and communities use it to drive insights and innovation. Explore common file types, real-world examples, and how open data portals make public information accessible, transparent, and valuable for everyone.
Selecting the right chart to visualize your data
With a multitude of chart types available, it's essential to match the data's characteristics and the story you want to tell with the appropriate visualization.