How to Find Key Financial Metrics in US Corporate Disclosure Documents
Corporate financial disclosure documents — like annual reports (Form 10-K) and quarterly reports (Form 10-Q) — contain nearly everything analysts, investors, and data engineers need to evaluate the performance of publicly-listed companies in the United States.
Whether you’re reading manually or building a data pipeline that scrapes filings from the SEC’s EDGAR database, it’s essential to know where to find each key metric.
This guide walks through where to locate and interpret common financial metrics directly from a company’s official filings.
1. Revenue (Total Sales)
Where to find it:
Income Statement (also called “Statement of Operations” or “Statement of Earnings”).
Typically listed near the top as “Total Revenue”, “Net Sales”, or “Operating Revenue.”
Example:
Total Revenue: $12,450,000,000
Search terms: “Revenue”, “Net Sales”, “Total Sales”
XBRL Tag: <us-gaap:Revenues> or <us-gaap:SalesRevenueNet>
2. Expenses
Where to find it:
Income Statement, immediately following Revenue.
Often broken into:
Cost of Goods Sold (COGS)
Selling, General & Administrative (SG&A)
Research & Development (R&D)
Depreciation & Amortization
Example:
Cost of Goods Sold: $5,200,000,000
Selling, General & Administrative: $2,100,000,000
XBRL Tag: <us-gaap:OperatingExpenses> or <us-gaap:CostOfRevenue>
3. Net Income
Where to find it:
Bottom line of the Income Statement.
Sometimes labeled as “Net Earnings” or “Profit (Loss).”
Formula:
Net Income = Total Revenue – Total Expenses – Taxes – Interest
XBRL Tag: <us-gaap:NetIncomeLoss>
4. Earnings Per Share (EPS)
Where to find it:
Income Statement, immediately below Net Income.
Reported as both Basic EPS and Diluted EPS.
Example:
Earnings Per Share:
Basic: $2.45
Diluted: $2.40
What’s the difference?
Basic EPS is calculated using only the shares currently outstanding.
Basic EPS = Net Income ÷ Weighted Average Shares Outstanding
Diluted EPS accounts for all potential shares that could be issued — for example, through stock options, convertible bonds, or warrants.
Diluted EPS = Net Income ÷ (Weighted Average Shares Outstanding + Potential Shares)
If the company has many outstanding stock options, diluted EPS will usually be lower than basic EPS, giving investors a more conservative estimate of earnings per share.
XBRL Tags:
<us-gaap:EarningsPerShareBasic> and <us-gaap:EarningsPerShareDiluted>
5. Named Executives’ Compensation
Where to find it:
DEF 14A (Proxy Statement), not in the 10-K or 10-Q.
Search for the “Summary Compensation Table” section. Below is an example taken from Microsoft’s 2024 DEF 14A filing.
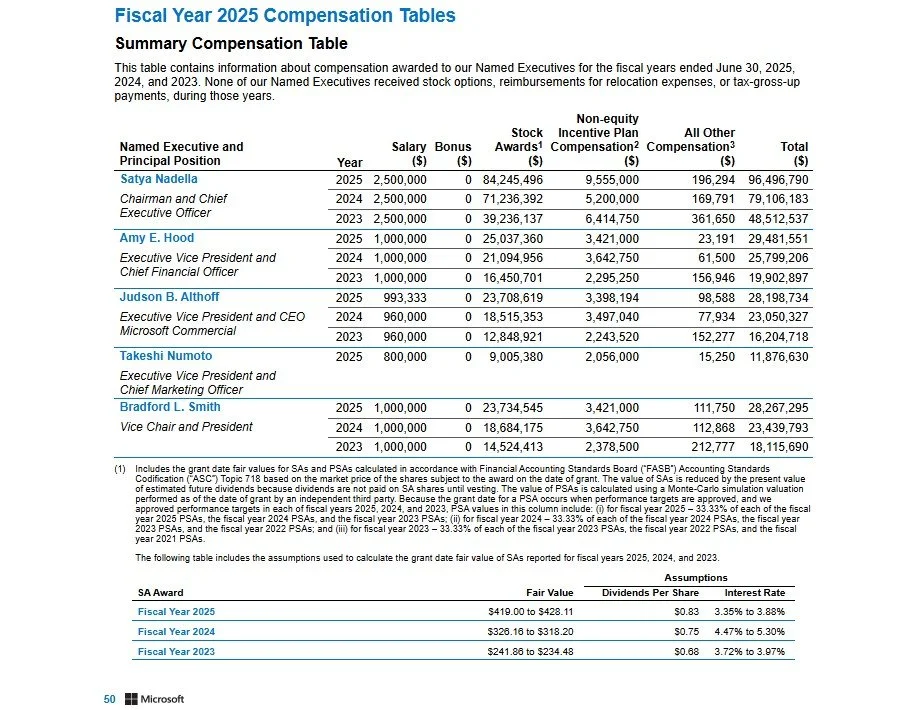
Includes:
Salary
Bonus
Stock awards
Non-equity incentives
Total compensation
Tip:
Search for “Summary Compensation Table” or names like “CEO”, “CFO”.
Data is also accessible through the SEC EDGAR XBRL feed.
6. EBITDA (Earnings Before Interest, Taxes, Depreciation, and Amortization)
Where to find it:
Often in the Management’s Discussion and Analysis (MD&A) section.
Usually presented as a non-GAAP measure with a reconciliation table.
Formula:
EBITDA = Net Income + Interest + Taxes + Depreciation + Amortization
Tip:
Search for “Adjusted EBITDA” or “Non-GAAP Reconciliation.”
7. Overview of Business
Where to find it:
Business section of the 10-K.
Provides a high-level overview of the company’s operations, markets, and structure.
Look for:
Business segments
Geographic reach
Key products or services
Competitive advantages
Search term: “Item 1. Business” or “Overview”
8. Cash Flow
Where to find it:
Statement of Cash Flows
Sections include:
Operating Activities
Investing Activities
Financing Activities
Example:
Net Cash from Operating Activities: $4,100,000,000
Net Cash Used in Investing Activities: ($1,200,000,000)
Net Cash Used in Financing Activities: ($2,000,000,000)
XBRL Tags:
<us-gaap:NetCashProvidedByUsedInOperatingActivities>
<us-gaap:NetCashProvidedByUsedInInvestingActivities>
<us-gaap:NetCashProvidedByUsedInFinancingActivities>
9. Cash Balance
Where to find it:
Balance Sheet, under Assets.
Look for:
“Cash and Cash Equivalents”
“Restricted Cash” (if applicable)
Example:
Cash and Cash Equivalents: $3,850,000,000
XBRL Tag: <us-gaap:CashAndCashEquivalentsAtCarryingValue>
Additional Key Metrics
These supplementary indicators provide a more complete view of a company’s financial health and efficiency.
10. Gross Profit
Where to find it:
Income Statement, directly below “Revenue” and “Cost of Goods Sold (COGS).”
Formula:
Gross Profit = Revenue – Cost of Goods Sold
Why it matters:
Shows how efficiently a company produces goods before factoring in overhead.
XBRL Tag: <us-gaap:GrossProfit>
11. Operating Income (EBIT)
Where to find it:
Income Statement, between Gross Profit and Net Income.
Formula:
Operating Income = Gross Profit – Operating Expenses
Why it matters:
Represents profit from core operations, excluding financing and taxes.
XBRL Tag: <us-gaap:OperatingIncomeLoss>
12. Total Assets and Total Liabilities
Where to find it:
Balance Sheet
Why it matters:
Shows the company’s overall financial position — what it owns versus what it owes.
XBRL Tags:
<us-gaap:Assets> and <us-gaap:Liabilities>
13. Shareholders’ Equity
Where to find it:
Balance Sheet, below Assets and Liabilities.
Formula:
Equity = Total Assets – Total Liabilities
Why it matters:
Represents ownership interest after debts are paid.
XBRL Tag: <us-gaap:StockholdersEquity>
14. Free Cash Flow (FCF)
Where to find it:
Derived from the Cash Flow Statement.
Formula:
FCF = Cash from Operations – Capital Expenditures
Why it matters:
Indicates how much cash is available for dividends, debt repayment, or reinvestment.
Often calculated manually, as it’s not always directly reported.
15. Debt-to-Equity Ratio
Where to find it:
Derived from Balance Sheet totals.
Formula:
Debt-to-Equity = Total Liabilities / Shareholders’ Equity
Why it matters:
Measures leverage — how much the company relies on borrowed money.
16. Return on Assets (ROA)
Where to find it:
Calculated from Income Statement and Balance Sheet.
Formula:
ROA = Net Income / Total Assets
Why it matters:
Shows how efficiently the company uses its assets to generate profit.
17. Return on Equity (ROE)
Where to find it:
Calculated from Net Income and Shareholders’ Equity.
Formula:
ROE = Net Income / Shareholders’ Equity
Why it matters:
Measures profitability relative to shareholder investment.
How Data Engineers Extract This Information Programmatically
To automate the process of extracting and comparing company data, data engineers often use the SEC’s EDGAR API or XBRL JSON feeds.
Tools and Libraries:
Python:
sec-api,edgar,xbrlparser,BeautifulSoupDatabases: PostgreSQL, BigQuery, Snowflake
Mapping: US GAAP XBRL taxonomy for schema alignment
Workflow Overview:
Query SEC EDGAR for filings (10-K, 10-Q, DEF 14A).
Parse XBRL elements for relevant financial tags.
Normalize and load data into structured tables.
Build dashboards or conduct time-series analysis.
Key Takeaway
Understanding where to locate key financial metrics in a company’s filings is a foundational skill for analysts, investors, and engineers alike.
Once you’re familiar with the structure of 10-Ks and 10-Qs, you can extract — and even automate — virtually every key performance indicator that matters.
| Metric | Where to Find It | Why It Matters |
|---|---|---|
| Revenue | Top line of the Income Statement (Form 10-K or 10-Q). Usually labeled “Total Revenue” or “Net Sales.” | Shows the company’s total income from goods and services before expenses. |
| Expenses | Below Revenue in the Income Statement, broken into operating, SG&A, R&D, etc. | Provides insight into cost structure and operating efficiency. |
| Net Income | Bottom line of the Income Statement — “Net Income” or “Profit.” | Measures the company’s profit after all expenses, taxes, and interest. |
| Earnings Per Share (EPS) | Shown beneath Net Income or in the notes to the financials. Includes Basic and Diluted EPS. | Represents profitability per share. Basic EPS uses actual shares; Diluted EPS includes potential shares from options or convertibles. |
| Named Executives’ Compensation | Found in the proxy statement (DEF 14A) or Form 10-K “Executive Compensation” section. | Reveals pay and incentives for senior leadership, offering insight into corporate governance. |
| EBITDA | Usually reported in the MD&A or as a non-GAAP reconciliation in the 10-K/10-Q. | Shows core operating performance before non-cash and financing effects. |
| Business Overview | Item 1 of the 10-K (“Business”) or the company’s annual report overview section. | Explains how the company operates, its segments, and strategic direction. |
| Cash Flow | Statement of Cash Flows in the 10-K or 10-Q, separated into operating, investing, and financing sections. | Shows how cash moves in and out of the business — vital for understanding liquidity and sustainability. |
| Cash Balance | Top of the Balance Sheet (“Cash and Cash Equivalents”). | Indicates available liquidity and short-term financial health. |
| Gross Profit | Revenue minus Cost of Goods Sold (often near the top of the Income Statement). | Shows how efficiently the company produces goods or services before overhead. |
| Operating Income (EBIT) | Midway in the Income Statement — sometimes labeled “Operating Profit.” | Captures profitability from core operations before financing and taxes. |
| Free Cash Flow (FCF) | Derived from Cash Flow Statement: Operating Cash Flow – Capital Expenditures. | Represents cash available for dividends, debt repayment, or reinvestment. |
| Debt-to-Equity Ratio | Calculated from the Balance Sheet: Total Liabilities ÷ Shareholders’ Equity. | Measures financial leverage and balance sheet risk. |
| Return on Equity (ROE) | Net Income ÷ Shareholders’ Equity, using data from the Income Statement and Balance Sheet. | Indicates how efficiently management uses equity to generate profits. |