Resources
Our team has compiled a list of resources to help you bring data stories to life.
A data analyst’s guide to making informative charts
Charts are one of the most powerful tools in data analysis. They help transform raw numbers into visuals that tell a story. Here’s a practical guide to making charts that bring clarity, not clutter.
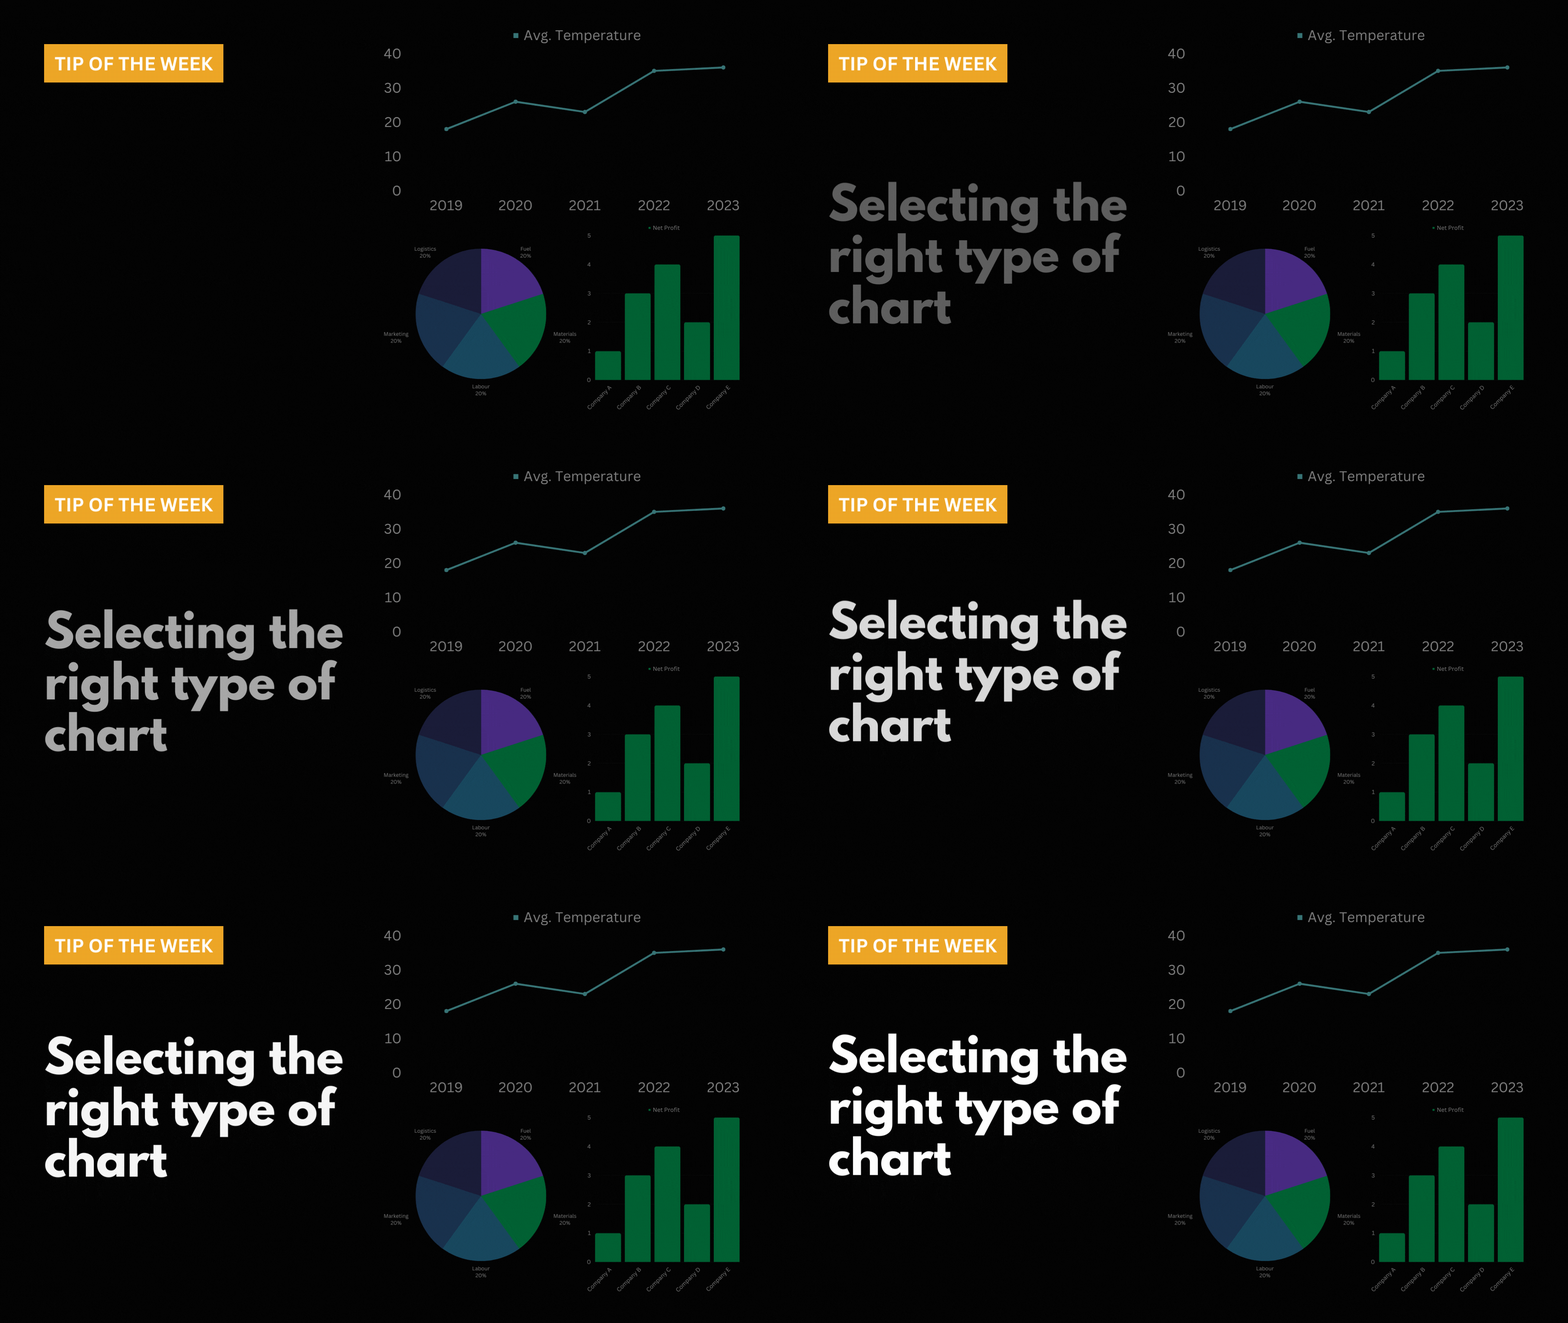
Selecting the right chart to visualize your data
With a multitude of chart types available, it's essential to match the data's characteristics and the story you want to tell with the appropriate visualization.


