How to Find and Use Data from Statistics Canada: A Complete Beginner's Guide
Statistics Canada is Canada’s official source for economic, social, and census data—but if you've never used it before, the sheer volume of information can feel overwhelming. With over 13,000 data tables and hundreds of surveys, where do you even start?
This guide will walk you through everything you need to know to find, understand, and download Canadian statistics with confidence. Whether you're a student working on a research paper, a journalist investigating a story, or simply curious about Canada, you'll learn the essential skills to navigate Statistics Canada like a pro.
Getting Started: Understanding the Statistics Canada Website
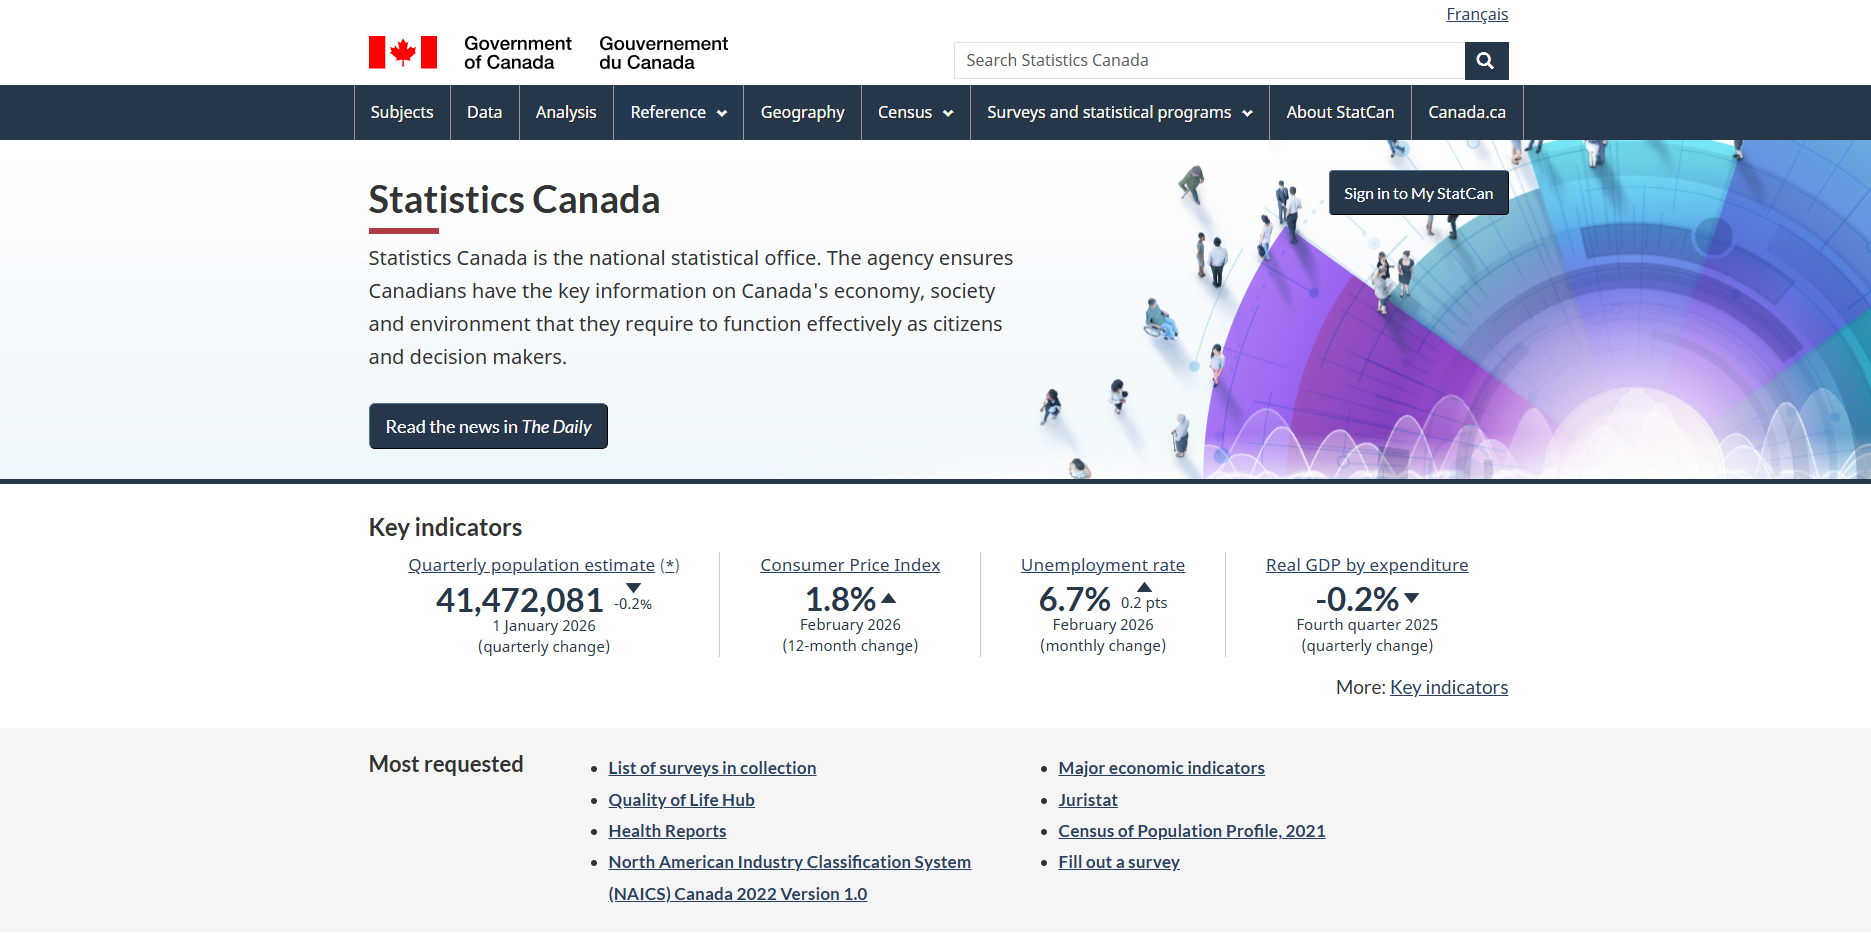
Visit www.statcan.gc.ca to access Canada's statistical treasure trove. The homepage is your gateway to four main ways of finding data:
By Subject - Browse organized categories like Labour, Health, or Economy
Through the Data Portal - Search all available data tables and profiles
Using Search - Keyword searching across the entire site
The Daily - New statistical releases published every weekday at 8:30 AM Eastern time
The Daily is particularly valuable if you want to stay current with Canada's latest statistics. It's released Monday through Friday and announces new data releases, analytical articles, and important updates.
Method 1: Finding Data by Subject
If you're exploring a general topic and aren't sure exactly what data exists, browsing by subject is the most intuitive approach.
How to Browse by Subject:
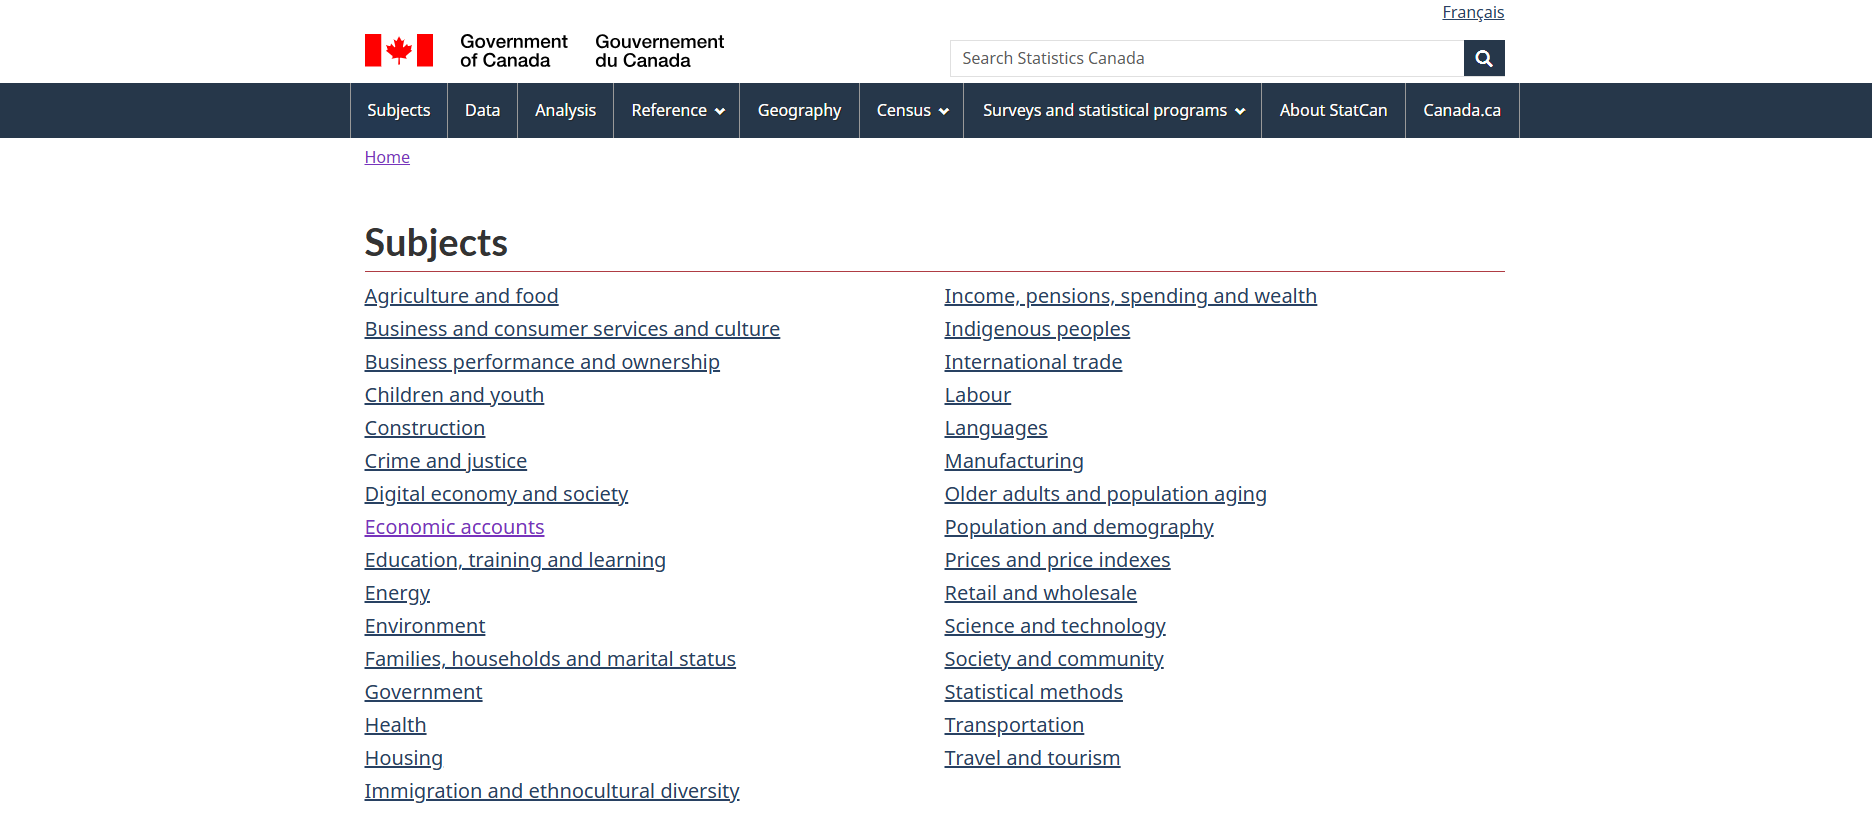
Click "Subjects" in the main navigation menu
Select your category of interest (for example, "Labour" for employment data)
Choose a sub-topic to narrow your focus
Review the results, which are organized into:
Tables - Raw data you can customize and download
Analysis - Reports, articles, and expert commentary
Reference - Methodology documents and definitions
Data visualizations - Interactive tools and charts
Pro Tip: Use the Filters
The left sidebar contains filters that help you narrow thousands of results:
Survey/Statistical program - See which survey collected the data
Geography - Filter by national, provincial, or local data
Frequency - Choose daily, monthly, quarterly, or annual releases
Data type - Focus on just tables, profiles, or analysis
These filters are essential. Without them, you'll be scrolling through hundreds of results trying to find what you need.
Method 2: Searching with Keywords
The search function is powerful, but it works best when you keep things simple.
Search Best Practices:
DO:
Use 2-4 keywords maximum
Keep terms broad and general
Try "unemployment rate" or "housing prices"
Search old CANSIM table numbers (they still work!)
DON'T:
Over-specify: "2024 unemployment rate Ontario youth 15-24" is too narrow
Use complex Boolean operators (AND, OR, NOT don't help here)
Include special characters or punctuation
Try to be too clever—simple wins
Understanding Your Search Results
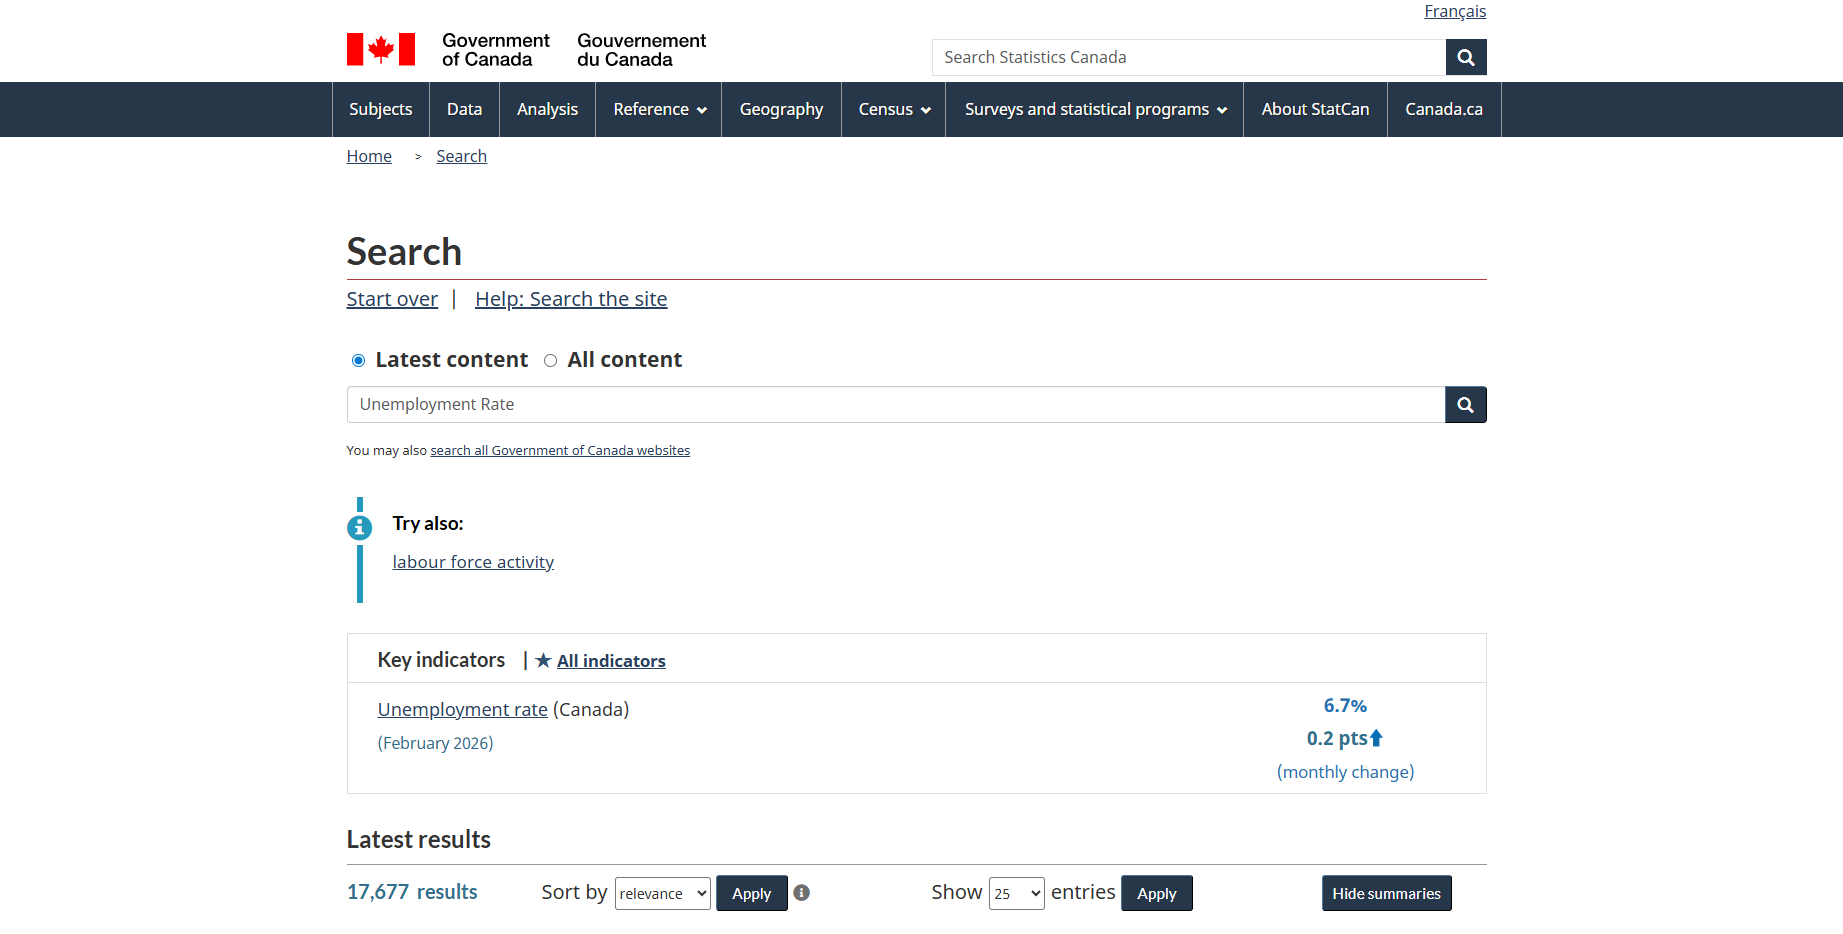
When you search, you'll see results labeled with:
Table numbers in the format XX-XX-XXXX-XX (e.g., 14-10-0090-01)
Frequency telling you how often the data updates
Geography indicating what regions are covered
Release dates showing when data was last updated
Sort your results by Date (most recent), Relevance, Most Popular, or Title to find what you need faster.
Understanding Data Tables: What You're Looking At
When you open a Statistics Canada data table, here's what you need to know:
Key Elements of Every Table
At the Top:
Table number and title - Your reference for citing this data
Frequency - How often new data is released (daily, monthly, quarterly, annually)
Geography - Which regions this data covers
Reference period - The date range of available data
Critical Note: Not all tables have provincial or territorial breakdowns. A table might only provide Canada-level data. Always check the geography field to confirm the detail level available.
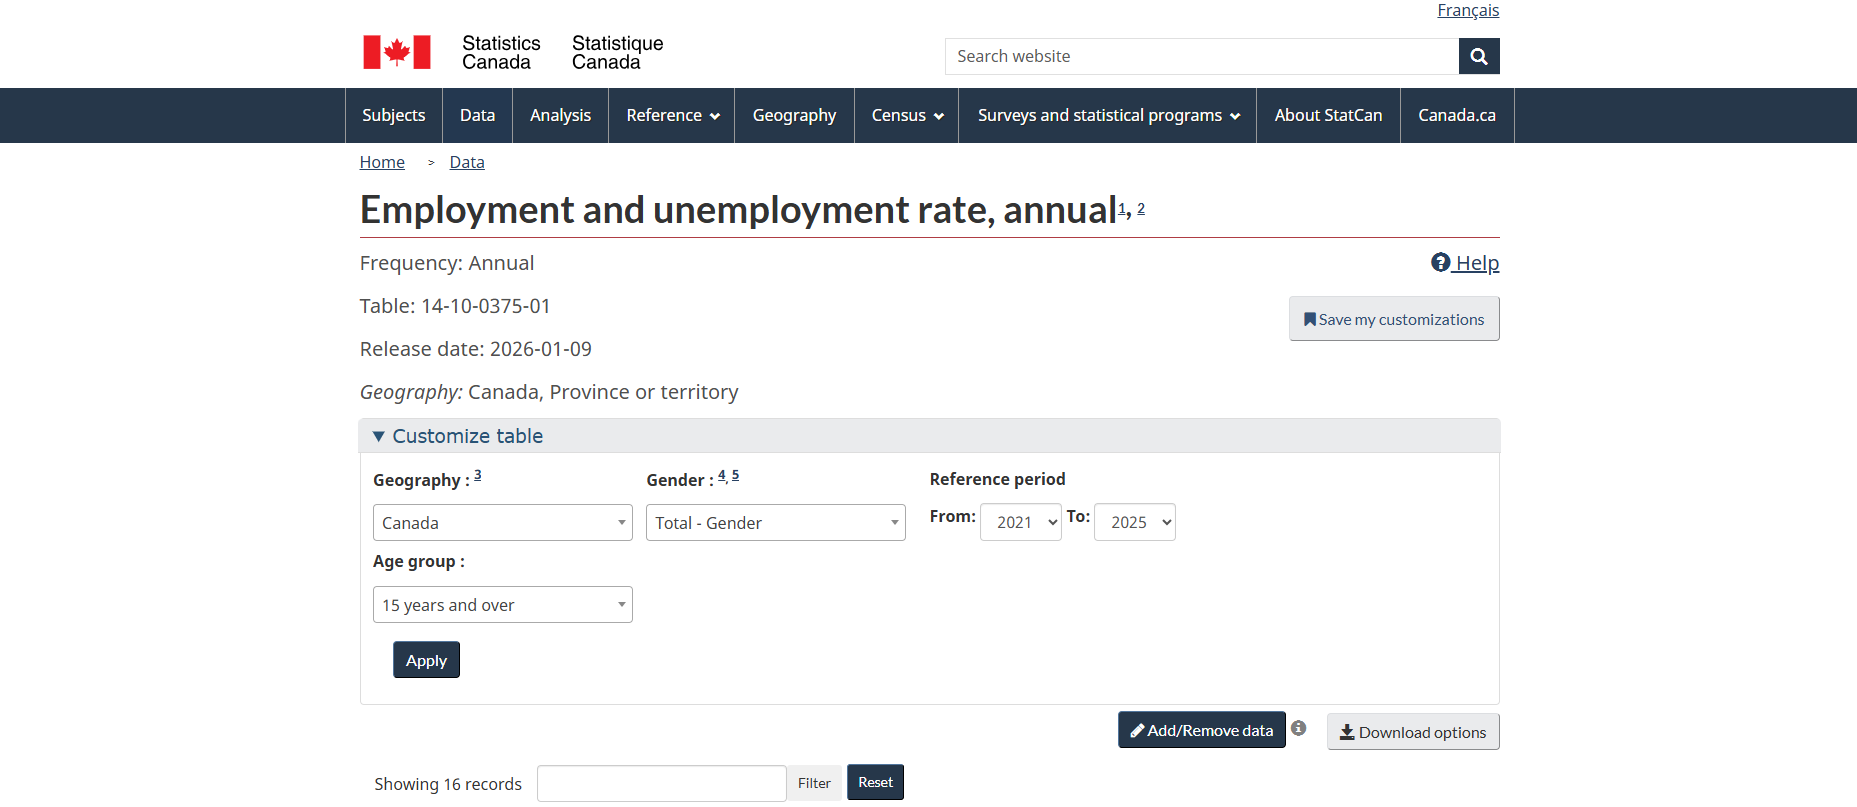
In the Middle:
Dropdown menus - Quick way to change one variable at a time
The data table itself - Your actual statistics
Customize table box - For basic customization
Add/Remove data button - For advanced customization
Add/Remove reference period button - To adjust time ranges
Download options button - To export your data
At the Bottom:
Footnotes - Critical context about limitations or methodology (don't skip these!)
Legend - Explains what symbols mean
Related information - Links to source surveys and related products
Citation - A suggested citation (adapt to your style guide)
Decoding the Legend: What Those Symbols Mean
This is crucial. Statistics Canada uses symbols to indicate data quality and availability:
F = Too unreliable to be published (high sampling error)
E = Use with caution (moderate sampling variability)
x = Suppressed to meet confidentiality requirements
.. = Not available for this specific reference period
... = Not applicable
0 or 0.0 = True zero or value rounded to zero
Why this matters: An "F" symbol means the data is too unreliable to trust. An "E" means you can use it, but note the uncertainty in your work. An "x" means Statistics Canada removed the value to protect someone's privacy.
The Importance of Footnotes
Footnotes appear as small numbered hyperlinks throughout the table. They contain essential information:
Methodology changes that affect comparisons over time
Data quality warnings
Definitions of terms used
Explanations of breaks in data series
Important context about what's included or excluded
Always read the footnotes. They often explain why data looks unusual or what limitations exist.
Customizing Tables: Getting Exactly What You Need
Statistics Canada's tables are highly customizable. There are two levels: basic and advanced.
Basic Customization: Using Dropdown Menus
For simple changes, use the dropdown menus at the top of the table:
Click a dropdown menu (e.g., "Geography")
Select a different option (e.g., change from "Canada" to "Ontario")
Click "Apply"
The table refreshes with your selection
Important: You MUST click "Apply" to see your changes. It won't update automatically.
The "Customize table" box shows you all available variables. At the bottom, you'll see an "estimated data points" counter. If this number gets too high, the table won't display in your browser—you'll need to either narrow your selections or download the full table.
Advanced Customization: Add/Remove Data
For comparing multiple regions, selecting specific age groups, or creating complex custom views, click the "Add/Remove data" button.
This opens a tabbed interface where you can:
Select Multiple Options:
Click the + symbol to expand a category (e.g., "Canada" under Geography)
Uncheck the top-level total (e.g., uncheck "Canada")
Check the specific items you want (e.g., select Ontario, Alberta, and British Columbia)
Repeat for other variables (age groups, sex, characteristics)
Click "Apply" when finished
Reorganize Your View:
Use the "Customize Layout" tab to switch what appears in rows vs. columns
This makes your table easier to read for your specific purpose
Pro Tips:
Uncheck "Total" categories if you only want subcategories
Use the search box within each tab to find specific items quickly
The + and - symbols expand and collapse sections
You can select multiple items across different categories
Downloading Your Data
Once you've customized your table, you'll want to export it. Click "Download options" to see your choices:
Download Options Explained
CSV for Excel (download as displayed)
Gives you exactly what you see on screen
Best for most users
Opens directly in Excel, Google Sheets, or similar programs
Includes your customizations
CSV for Excel (download entire table)
Provides ALL available data in the table
Much larger file
Useful if you want everything to analyze yourself
Doesn't include your specific customizations
SDMX formats
Statistical Data and Metadata eXchange format
For advanced users and statistical software
Includes detailed metadata
Web data services / API
For programmers automating data collection
Allows direct database queries
Requires technical knowledge
The "Save My Selections" Feature
This incredibly useful button creates a custom URL containing all your table customizations. You can:
Bookmark it to return to this exact view
Share it with colleagues
Use it in reports so others can verify your data source
Return month after month to see updated data in the same format
The URL looks complex, but it preserves every filter and customization you made.
Understanding File Formats
CSV (Comma-Separated Values):
Standard spreadsheet format
Opens in any spreadsheet software
Easy to work with
Currently the standard for Statistics Canada
Beyond 20/20 (.ivt files):
Older proprietary format
Being phased out in favor of CSV
You may see older tables using this format
Requires special software to open
Other Essential Features
The Daily: Staying Current
The Daily is Statistics Canada's official release bulletin, published every weekday at 8:30 AM Eastern time. It announces:
New data releases across all topics
Analytical articles explaining trends
Corrections or revisions to previously released data
Highlights of what's new
How to use The Daily:
Visit it directly from the homepage
Subscribe by email to receive notifications
Filter by subject to see only topics you care about
Check release schedules to know when data you're waiting for will appear
Census Data: Canada's Most Detailed Information
The Census of Population occurs every five years (the next one is scheduled for May 2026). It provides the most detailed demographic and social data available:
Census Products:
Census Profiles - Community-level data for every city and region
Data tables - Detailed cross-tabulations of census questions
Focus reports - Analysis of specific topics
Data visualizations - Interactive maps and charts
Census data goes deeper than regular surveys because it attempts to count everyone in Canada, rather than using a sample.
Data Visualizations: Visual Alternatives to Tables
Not comfortable working with raw data? Statistics Canada offers interactive visualizations:
Interactive dashboards showing trends over time
Maps displaying regional variations
Comparison tools for exploring relationships
User-friendly interfaces requiring no data analysis skills
Browse these under "Data visualizations" in subject areas or search results.
Getting Notifications: Never Miss New Data
You can subscribe to specific topics and receive email notifications when new data is released:
Look for "Subscribe" links on topic pages
Create a free account
Select topics of interest
Receive alerts when new data publishes
This is perfect for researchers tracking specific indicators over time.
Common Mistakes to Avoid
Learn from others' mistakes:
1. Skipping the Footnotes
The Problem: You miss critical context about data limitations or methodology changes.
The Solution: Always check footnotes, especially for the first row or column of your area of interest.
2. Ignoring Legend Symbols
The Problem: You cite an "F" value in your work, not realizing it's too unreliable to use.
The Solution: Check what any letter symbol means before using that data point.
3. Searching Too Specifically
The Problem: "2024 youth unemployment rate ages 15-19 Ontario January" returns no results.
The Solution: Start broad ("unemployment rate"), then use filters and customization to narrow down.
4. Not Using Filters
The Problem: Scrolling through 500 results trying to find the right table.
The Solution: Use the filter panel on the left side of search results immediately.
5. Forgetting to Click "Apply"
The Problem: Selecting dropdown options but wondering why the table didn't change.
The Solution: Always click "Apply" after making customizations.
6. Overlooking Geography Limitations
The Problem: Expecting provincial data but finding only national-level statistics.
The Solution: Check the "Geography" field before diving deep into a table.
7. Misunderstanding Data Frequency
The Problem: Using annual data when monthly updates are available, or expecting daily updates when data is quarterly.
The Solution: Check the "Frequency" field to know how current the data can be.
8. Confusing Reference Period with Release Date
The Problem: A table released in April 2026 might contain data from January 2026—there's a processing lag.
The Solution: Always check the actual reference period of the data, not just the release date.
9. Not Checking Related Tables
The Problem: Missing better or more recent data available in a related table.
The Solution: Scroll to "Related information" at the bottom of every table page.
10. Downloading Without Customizing
The Problem: Downloading massive files containing far more data than needed.
The Solution: Customize first, then use "Download as displayed" for cleaner, smaller files.
Practical Example: Finding Your Province's Unemployment Rate
Let's walk through a complete example from start to finish.
Goal: Find the most recent unemployment rate for Ontario.
Step 1: Search
Go to www.statcan.gc.ca
Type "unemployment rate" in the search bar
Press Enter
Step 2: Filter Results
Under "Type," check Tables
Under "Frequency," check Monthly (for most current data)
Click Apply
Step 3: Select the Right Table
Look for "Labour force characteristics by province, territory and economic region"
This is table 14-10-0090-01
Click to open it
Step 4: Customize for Ontario
In the "Geography" dropdown, select Ontario
Click Apply
The table refreshes to show only Ontario data
Step 5: Find the Latest Data
Look at the rightmost column (most recent month)
Find the row labeled "Unemployment rate"
Read the value
Step 6: Verify Data Quality
Check if there's an E or F symbol next to the value
Read any footnotes (click the small numbered links)
Note the reference period
Step 7: Download or Cite
Click "Download options"
Select "CSV for Excel (download as displayed)"
OR click "Save my selections" to bookmark this exact view
Use the citation at the bottom of the page, adapting it to your style guide
Total time: 2-3 minutes once you know the process.
Advanced Tips for Power Users
Once you're comfortable with the basics, these advanced features can save significant time.
Vector Numbers: Direct Data Access
Every individual data point in Statistics Canada's database has a unique "vector" identifier. If you know the exact vector numbers you need:
Use the "Search by vector" feature
Enter multiple vector numbers separated by commas
Get a custom table with just those specific data points
This is useful for researchers who track the same indicators over time.
API Access for Automation
If you're comfortable with programming, Statistics Canada offers API access:
Automatically pull updated data into your applications
Schedule regular data harvests
Integrate Canadian statistics into dashboards or websites
Available for all data tables
Visit the "Developers" section under Download options for documentation.
Understanding Survey Methodologies
When data quality matters for your work:
Click through to the source survey information
Read about sample sizes and methodology
Understand confidence intervals for survey data
Know when to trust numbers and when to add caveats
This information is available in the "Related information" section of each table.
Working with Time Series Data
For trend analysis:
Use "Add/Remove reference period" to select date ranges
Download the entire time series for analysis in statistical software
Watch for methodology breaks that affect comparisons
Check footnotes for changes in definitions over time
Special Data Types and How to Use Them
Public Use Microdata Files (PUMFs)
These are individual-level survey responses with identifying information removed:
Allow you to run your own statistical analysis
Available for many major surveys
Require statistical software knowledge
Some available free; others through secure research data centers
Census Profiles
Community-specific data for every Canadian municipality:
Search by postal code or place name
Compare multiple communities side-by-side
See demographic breakdowns at the neighbourhood level
Perfect for local planning and research
Data Visualization Tools
Interactive explorers for specific topics:
Labour market dashboards
Consumer Price Index explorer
COVID-19 data tracking
Economic indicators at a glance
These provide polished, user-friendly ways to explore data without downloading tables.
Citing Statistics Canada Data
Proper citation ensures others can verify your sources and gives credit appropriately.
Basic Citation Format
Statistics Canada provides a suggested citation at the bottom of every table. A typical format:
For a data table:
Statistics Canada. Table 14-10-0090-01 Labour force characteristics by province, territory and economic region, annual. DOI: https://doi.org/10.25318/1410009001-eng
For The Daily:
Statistics Canada. (2026, March 16). Consumer Price Index, February 2026. The Daily. Retrieved from https://www150.statcan.gc.ca/n1/daily-quotidien/260316/dq260316a-eng.htm
What to Include
Organization: Statistics Canada
Title of the table or article
Table number (for data tables)
Date accessed or release date
URL or DOI
Adapt this to your required citation style (APA, MLA, Chicago, etc.).
Getting Help When You're Stuck
Statistics Canada offers multiple support resources:
Official Help Resources
Help Centre - Searchable FAQ database
Video Tutorials - Official guides on specific topics
Training Sessions - Periodic webinars and workshops
Contact Form - Direct questions to Statistics Canada staff
Third-Party Resources
Many university libraries create Statistics Canada guides:
University of British Columbia
University of Toronto
Statistics Canada training videos on YouTube
These often provide step-by-step screenshots and discipline-specific examples.
When to Contact Statistics Canada Directly
You need data not publicly available
You're having technical issues with downloads
You need clarification on methodology
You're working on academic research requiring custom tabulations
The agency is generally responsive and helpful, especially for academic and research inquiries.
Understanding Data Limitations and Quality
Not all data is created equal. Here's what to watch for:
Sample Size Matters
Survey data based on small samples:
Has higher margins of error
Gets marked with "E" (use with caution) or "F" (too unreliable)
Is less reliable for small geographic areas or subpopulations
Requires care when making claims
Confidentiality Suppression
Values marked with "x" have been suppressed:
This protects individual privacy
Often happens in small communities or for rare characteristics
You cannot calculate these values from other data
Attempting to derive suppressed values violates privacy rules
Methodology Changes
Watch footnotes for:
Changes in survey questions
Updates to classification systems
New data collection methods
Revisions to historical data
These can create breaks in time series data, making direct comparisons inappropriate.
Seasonal Adjustment
Some data is "seasonally adjusted":
Removes predictable seasonal patterns
Allows month-to-month comparisons
Different from "unadjusted" data
Check which version you're using
Both versions may be available in the same table—make sure you're consistent.
Building Your Statistics Canada Workflow
As you become more proficient, develop an efficient personal workflow:
For Regular Data Tracking
Find your key tables once
Use "Save my selections" to bookmark custom views
Subscribe to The Daily for your topics
Check bookmarked tables when new data releases
Download and compare to previous periods
For New Research Projects
Start with subject browsing to understand available data
Search keywords once you know what you need
Filter aggressively to narrow options
Read methodology documents for key tables
Set up email notifications for related releases
For Quick Fact-Checking
Use simple keyword search
Sort by "Most Popular" to find commonly-used tables
Use dropdown menus for quick customization
Check the most recent reference period
Verify with footnotes and legend symbols
Real-World Applications
Here's how different users make Statistics Canada work for them:
Students and Researchers
Cite authoritative Canadian data in papers
Access historical time series for trend analysis
Download microdata for original statistical analysis
Compare regional variations in social phenomena
Journalists and Writers
Fact-check claims about Canada
Find recent statistics for news stories
Create data-driven visualizations
Track changes over time for investigative pieces
Business Analysts
Monitor economic indicators
Track industry-specific trends
Compare regional markets
Inform strategic planning with demographic data
Policy Makers and Government Staff
Access official statistics for planning
Compare jurisdictions
Monitor program outcomes
Justify decisions with evidence
Community Organizations
Understand local demographics
Identify service needs
Support grant applications with data
Track community changes over time
Keeping Your Skills Current
Statistics Canada evolves continuously. Stay updated:
What Changes
New data tables are added regularly
Website functionality improves
Classification systems get updated
New surveys launch
How to Stay Informed
Subscribe to The Daily
Follow Statistics Canada on social media
Check the "What's New" section
Attend training webinars when offered
Revisit official tutorial videos periodically
Practice Regularly
Like any skill, finding data gets easier with practice. Set yourself challenges:
Find three interesting statistics about your community each month
Track one economic indicator over a year
Compare your province to others on a topic you care about
Try customizing increasingly complex tables
Conclusion: You're Ready to Explore Canadian Data
Statistics Canada contains an incredible wealth of information about Canada, but it's only useful if you can find what you need. You now have the essential skills:
✓ You know how to search effectively using keywords and subjects
✓ You understand what data tables contain and how to read them
✓ You can customize tables to show exactly what you need
✓ You know how to download data in usable formats
✓ You understand data quality indicators and limitations
✓ You can avoid common mistakes that trip up beginners
The best way to solidify these skills is to dive in and try. Pick a topic you're curious about and explore. With practice, navigating Statistics Canada will become second nature.
Remember: keep searches simple, use filters liberally, always check footnotes and legend symbols, and don't forget to click "Apply" when customizing tables.
Happy researching!
Quick Reference Card
Essential Links
Homepage:www.statcan.gc.ca
Data search:www.statcan.gc.ca/en/search/data
The Daily:www.statcan.gc.ca/en/dai
Census:www.census.gc.ca
Key Symbols
F = Too unreliable to publish
E = Use with caution
x = Suppressed for confidentiality
.. = Not available
Critical Buttons
Apply = Make changes appear
Add/Remove data = Advanced customization
Download options = Export your data
Save my selections = Bookmark this view
Search Tips
Keep it simple: 2-4 keywords
Use filters immediately
Sort by date for most recent
Try old CANSIM numbers
Before You Download
✓ Check footnotes
✓ Verify legend symbols
✓ Confirm reference period
✓ Note geography level
✓ Customize to reduce file size
Last Updated: April 2026
Based on: Statistics Canada website as of April 2026